As of update 0.15.14, Cosmoteer now includes a "part debugger" tool. This is a developer-mode tool that displays the status of a part and all of the components it contains, which should make solving many kinds of part logic bugs much easier.
To use the Part Debugger, you'll first need to run Cosmoteer in "developer mode", using one of these methods:
- If you're running standalone Cosmoteer, search your start menu for a shortcut called
Cosmoteer (Developer Mode) and run it.
- If you're running the Steam version of Cosmoteer, you should receive a prompt to select developer mode when launching the game via Steam.
- If neither of those work for you (or you want to create your own shortcut), simply add the
--devmode argument to Cosmoteer's executable path.
Once you're running in developer mode, simply start a new game and then press Ctrl+~ to open the developer menu. (If you have an English keyboard, the ~ key is the one in the corner right above the Tab key and usually below the Esc key. If you have a non-English keyboard then this key may be labeled differently and be in a different location; keep pressing keys until you find it!)
With the developer menu open, click Sim and then Part Debugger:

This will open up a small window. If you don't have a part selected, then you'll see a message Select a single part. But if you do what it says and select a single part, you'll see the part debugger!
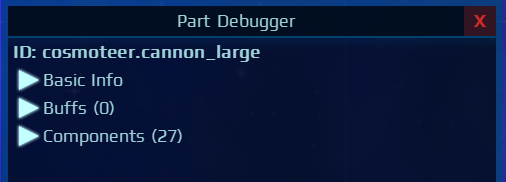
The part debugger will show the ID of the currently-selected part and has three categories of information that can be expanded.
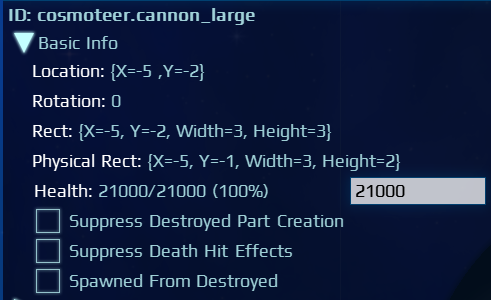
The first category is Basic Info, which shows the location, rotation, rectangles, health, and a few flags. Note that you can directly modify a part's health by typing a number into the white textbox, which can be useful for debugging damage sprites and other damage-based logic.
The second category is Buffs, which will show any buffs being applied to the part, the values of those buffs, and where those buffs are coming from.

The third and most interesting/useful category is Components, which displays every single component that is currently on the part. (This includes components that are disabled via an OperationalToggle but does not include any components that are active because they are defined within an inactive ToggledComponents component.)
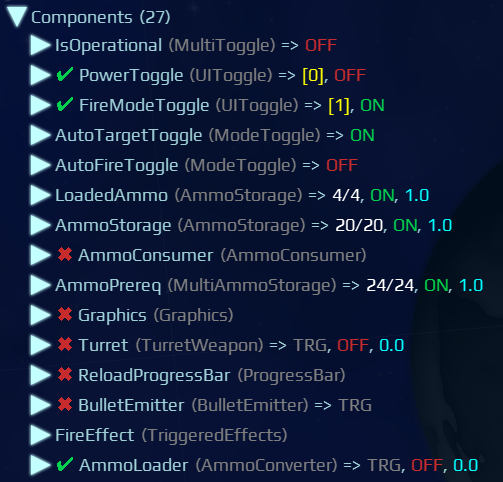
Any components that can support an OperationalToggle will display either a green checkmark (it's operational) or red X (it's not operational) to the left of the component's name. If the component supports an OperationalToggle but doesn't actually use one, then it will always be operational and thus always show a green checkmark.
If you know anything about Cosmoteer modding, then you'll likely know that some components can be used as inputs, providing information to other components, and different components can provide different kinds of inputs. The inputs provided by each component are displayed to the right of the component's name and type:
- If the component provides a "toggle" input, then it will show either a green
ON or a red OFF depending on the state of the toggle.
- If the component provides a numerical "value" input, then that value will be displayed as a light-blue decimal number.
- If the component provides a "mode" input, then the mode will be displayed in yellow within square brackets, such as
[0].
- If the component stores, provides, or reports ammunition, then the current amount and capacity of ammo will be displayed in white as a fraction, such as
20/24.
- If the component can trigger other components, then a gray
TRG will be displayed. The TRG will flash orange briefly whenever triggered.
Every component can also be expanded, which will usually show additional information about that component, such as its location, rotation, and the status of any other relevant components that its getting input from:
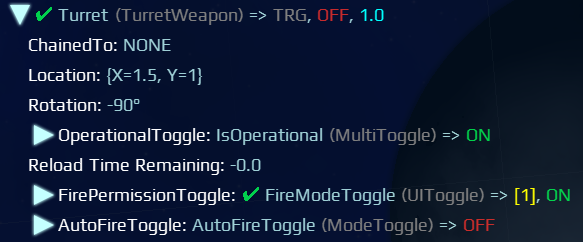
If you expand any kind of ammo storage component, then you can use the part debugger to "cheat" and directly modify the amount of ammo that it is storing by typing a new number into the white textbox. This can be very useful when debugging any part logic that depends on ammo quantities.

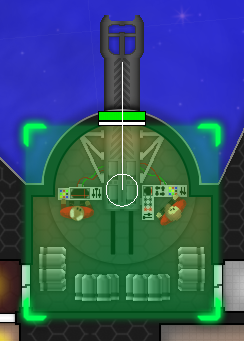
Any component that can have a location and rotation will also display its location and rotation visually when the component is expanded in the part debugger. The white circle shows the location on which the component is centered, and the white line sticking out of the circle shows its rotation. (A rotation of 0 degrees on an unrotated part will point directly to the right.)
That's all I can think of to explain. Please let me know if you have any questions about the part debugger!
